Scotland’s Census 2022 - Housing
![]()
An Accredited Official Statistics publication for Scotland
Published: 22 August 2024
This report presents census data on housing and people living in communal establishments. These statistics show how Scotland’s people, and where they live, are changing.
Census data will help government, charities and other service providers to understand more about the needs of people in Scotland.
“The number of households who own their home outright increased by 28.8% since 2011.”
Jon Wroth-Smith, Director of Census Statistics, National Records of Scotland
Tenure: owning or renting
Census data on tenure describes whether a household rents or owns the accommodation they live in.
The census figures in this section are counts of households (groups of people). They are not counts of the accommodation (actual houses, flats, etc.). And they do not include empty properties. The Scottish Government publishes data on housing stocks which provides a better indication of housing supply by tenure.
In 2022 there were 2,509,300 households with at least one usual resident. This is up 136,500 (5.8%) from the 2011 census.
On Census Day around two thirds (63.2%) of households in Scotland owned their home (1,585,800 households). Around one third (35.4%) of households rented their home (887,600). Around one household in a hundred (1.4%) lived rent free (35,900).
The number of households that owned their home outright increased compared to previous censuses. In 2022 851,100 (33.9%) of households owned outright compared to 660,600 (27.8%) in 2011 and 513,600 (23.4%) in 2001. Census data suggests this is related to Scotland’s ageing population. There are more older people living in Scotland. Home owners in older age groups are likely to have had longer to pay off their mortgage.
There has been a decrease in the number of households who own with a mortgage. This is related to the increase in households owning outright. Most of these households are likely to have had a mortgage and paid it off.
The number of households that were renting increased in 2022 to 887,600. This is up 16,300 (1.9%) since 2011 (871,300 households). This was driven by an increase in households privately renting. There were 323,000 households privately renting in 2022. This is up 28,200 (9.5%) compared to 2011 (294,900). Data on the number of registered landlords and properties is published by the Scottish Government as part of the quarterly Scottish Landlord Register data.
In the same period the number of households in social rented accommodation decreased, to 564,500 in 2022. This is down 11,900 (2.1%) since 2011. However data on housing stocks shows that the supply of social sector housing increased by over 23,000 units between 2011 and 2022 (Chart 7, Housing Statistics 2022 & 2023: Key Trends Summary, Supporting documents, Scottish Government).
We can look at census data on tenure by age. To do this we choose one household reference person (HRP) for each household. We can then use their age to analyse the data on tenure. We will be able to use data on other characteristics of the HRP to analyse tenure data later in 2024. More information on how HRPs are chosen is available in the census metadata. The HRP can generally be thought of as the ‘householder’.
Analysis by age shows that the increase in households owning outright is related to the ageing population in Scotland. The majority of the increase in households owning outright was due to increases in older age groups. Home owners in older age groups are likely to have had longer to pay off their mortgage.
There were 135,200 more householders aged 65 and over owning outright in 2022, compared to 2011. Around two thirds (67.5%) of householders aged 65 owned outright.
The majority of homes owned outright (58.4%) had a householder aged 65 and over. This has increased compared to 2011 (54.8%). Around nine in ten households owning outright had a householder aged 50 and over.
The overall percentage of households who owned their home (63.2%) increased slightly since 2011 (62.0%). There were also relatively small changes within age groups but the overall pattern was relatively similar to 2011.
Overcrowding and under-occupancy
The census collects information on the number of people in each household. It also collects information on the number of bedrooms in each household’s accommodation.
We can use this information to work out whether a household has the required number of bedrooms. We work this out using the 'bedroom standard' from the Housing (Overcrowding) Bill 2003.
If a household has more bedrooms than it needs, it is described as under-occupied. It will have an occupancy rating of +1 or higher. A rating of +1 means one more bedroom than required. A rating of +2 means two more bedrooms than required.
If a household has fewer bedrooms than it needs, it is described as overcrowded. It will have an occupancy rating of -1 or lower. A rating of -1 means one fewer bedroom than required.
More information on occupancy ratings and the bedroom standard is provided in the census metadata. It is important to note that households may not consider themselves to be overcrowded or under-occupied although the bedroom standard describes them as such.
“In 2022 just under one third (32.2%) of households in Scotland had at least 2 more bedrooms than required.”
Jon Wroth-Smith, Director of Census Statistics, National Records of Scotland
In 2022 70.3% of households had more bedrooms than required (1,763,000). Around one in forty households (2.4%) had fewer bedrooms than required (59,300). Just over a quarter (27.4%) of households were in line with the standard (687,100).
Census data from England and Wales shows relatively similar percentages to Scotland. In 2021 69.2% of households were under-occupied, 4.3% were overcrowded and 26.5% were in line with the standard.
Under-occupied households
In this section we look at households with an occupancy rating of +2 or higher. In 2022 just under one third (32.2%) of households had at least 2 more bedrooms than required.
Figure 3 shows the percentage of households in each council area that had at least 2 more bedrooms than required.
Island council areas tended to have higher rates of under-occupancy. Between 40% and 51% of households in island council areas had an occupancy rating of 2+. Other council areas in the north and south of Scotland had similar rates.
Na h-Eileanan Siar (50.6%), Aberdeenshire (45.6%), Shetland Islands (44.5%) and Orkney Islands (44.1%) had the highest percentage of households with at least 2 more bedrooms than required.
These council areas tended to have lower population density. They had a lot more households living in houses than flats, and more bedrooms on average. They also had relatively more people in older age groups.
“Around one in twenty (4.7%) households in the Glasgow City council area were overcrowded.”
Jon Wroth-Smith, Director of Census Statistics, National Records of Scotland
Overcrowded households
Around one in forty households in Scotland (2.4%) had at least one fewer bedroom than required. These households are described as overcrowded using the bedroom standard.
Figure 4 shows that ‘City’ council areas had higher rates of overcrowding. Council areas near the ‘City’ council areas also had relatively high rates, especially in the west of Scotland.
Around one in twenty (4.7%) households in Glasgow City were overcrowded. Dundee City had the next highest rate of overcrowding (3.2% of households).
Census data allows us to look at how smaller areas within a council area compare. Figure 5 shows how overcrowding varies across intermediate zones in Glasgow City. The average intermediate zone in Glasgow is home to around 4,500 people.
There are four areas in the south side of Glasgow that stand out. The four intermediate zones in Govanhill and Pollokshields had the highest percentage of households with at least one fewer bedroom than required (between 10.6% and 13.3%).
There are differences between these areas in terms of average household size (ranging from 2 to 3), average number of bedrooms (2 to 3), and percentage of households in flats (72% to 97%).
One thing the four Govanhill and Pollokshields intermediate zones have in common is a high percentage of people from minority ethnic groups (between 58% and 64% of their populations).
All four areas had a high percentage of people with a Pakistani background (34% to 38%). Pollokshields West also had a relatively high percentage with an Indian background (4.0%). Three of the four areas had a relatively high percentage of people with an African background (around 3%). And Govanhill West had a relatively high percentage with a Roma background (3.3%).
The Scottish Government has published research on the housing needs of minority ethnic groups. There is evidence of a link between ethnic group and overcrowding. Combined Scottish House Condition Survey data from 2016-2019 shows that a significantly higher proportion of minority ethnic households were overcrowded. Evidence suggests that the reasons for overcrowding are complex. There are several possible underlying factors including extended families living together, housing availability, poverty and preference (Housing needs of minority ethnic groups: Evidence review, Scottish Government).
Census data from 2011 also shows a link between ethnic group and overcrowding. However the 2011 census asked about rooms in general, rather than bedrooms. So the 2011 census data on overcrowding is not directly comparable with 2022. We will be able to combine data from different questions in the 2022 census to explore overcrowding by ethnic group later in 2024.
“There were over 80,000 more households living in detached houses than in 2011.”
Jon Wroth-Smith, Director of Census Statistics, National Records of Scotland
Accommodation type
Almost a third (32.4%) of households in Scotland lived in a tenement or a purpose built block of flats (813,500). Over half (51.8%) of these households were living in ‘City' council areas.
The next most common accommodation type was detached houses 600,700 (23.9%) closely followed by semi-detached houses 584,800 (23.3%).
Figure 6 shows the number of households living in each type of accommodation in 2011 and 2022. This shows that the ‘house’ categories saw the biggest increases, with 80,600 more households living in detached houses and 43,400 more living in semi-detached houses compared to 2011.
Midlothian council area saw the largest percentage increase in its population compared to 2011. It also had the biggest percentage increase in households living in detached houses, up 44.9% (3,100). In total there were 41,000 households living in Midlothian in 2022. This is an increase of 6,000 (17.2%) compared to 2011.
The biggest increase in households living in detached houses was in Aberdeenshire (7,000) followed by South Lanarkshire (6,700).
The number of households living in a tenement or purpose-built flat in Scotland increased by 2,200. There was a large increase in Edinburgh (up 9,600). But this was offset by decreases in several council areas including North Lanarkshire (down 3,900) and Glasgow City (down 2,300). Some of these decreases will be related to the closure and demolition of high-rises.
People living in communal establishments
On Census Day in March 2022, there were 56,000 people living in student accommodation or halls of residence. This is an increase of 22,600 people or 67.5% since 2011. This reflects an increase in the number of university students in Scotland over the same period (Students in Higher Education, 2010-11 and 2021-22, Higher Education Statistics Agency, HESA).
There were 30,800 people living in care homes on census day. This is a decrease of 5,200 people or 14.5% since 2011. Meanwhile the number of older people in Scotland increased over the same period.
Data from Public Health Scotland shows a gradual decrease in the number of adult care home residents in Scotland over the last decade (Figure 12, Care home census for adults in Scotland, Public Health Scotland). This decrease may be explained by the Scottish Government moving towards supporting older people to live independently at home (Reshaping Care for Older People Programme: 2011 – 2021, Scottish Government).
There were 16,900 people living in another type of communal establishment, such as a prison, school, or defence establishment. This is a decrease of 5,400 people or 24.4% since 2011.
Household deprivation indicator
Background
This report accompanies the publication of Scotland’s Census 2022 data on household deprivation. Deprivation is a complex subject area and official statistics such as the Scottish Index of Multiple Deprivation already exist. Census data is unique in that it can indicate deprivation at household level, rather than at an aggregate geographic level. This quality note discusses the coherence of a census-based indicator to equivalent indicators derived from census data for the rest of the UK as well as area-based measures like the Scottish Index of Multiple Deprivation.
How is household deprivation calculated?
Household deprivation in Scotland’s Census 2022 is measured by assessing whether a household is deprived in one or more of four dimensions. These dimensions are:
- Employment – A household is deprived if there is at least one person in the household aged 16 and over who is not a full-time student and is either unemployed or economically inactive due to long-term sickness or disability.
- Education – A household is deprived if no person aged 16 and over has at least Level 2 qualification (e.g. SCE Higher, Advanced Higher, or equivalent), and no person aged 16-18 is in full-time education
- Health and Disability – A household is deprived if any person in the household has general health that is ‘bad’ or ‘very bad’ or has a long-term health problem
- Housing – A household is deprived if the accommodation is either overcrowded (fewer bedrooms than required under the bedroom standard), in a shared dwelling or has no central heating.
Households are then assigned a deprivation score from 0 to 4, depending on how many dimensions apply.
Comparisons with other UK census data
Figure 9: the percentage of households in Scotland deprived in one, two, three or four dimensions and the percentage of households in Scotland not deprived in any dimension.
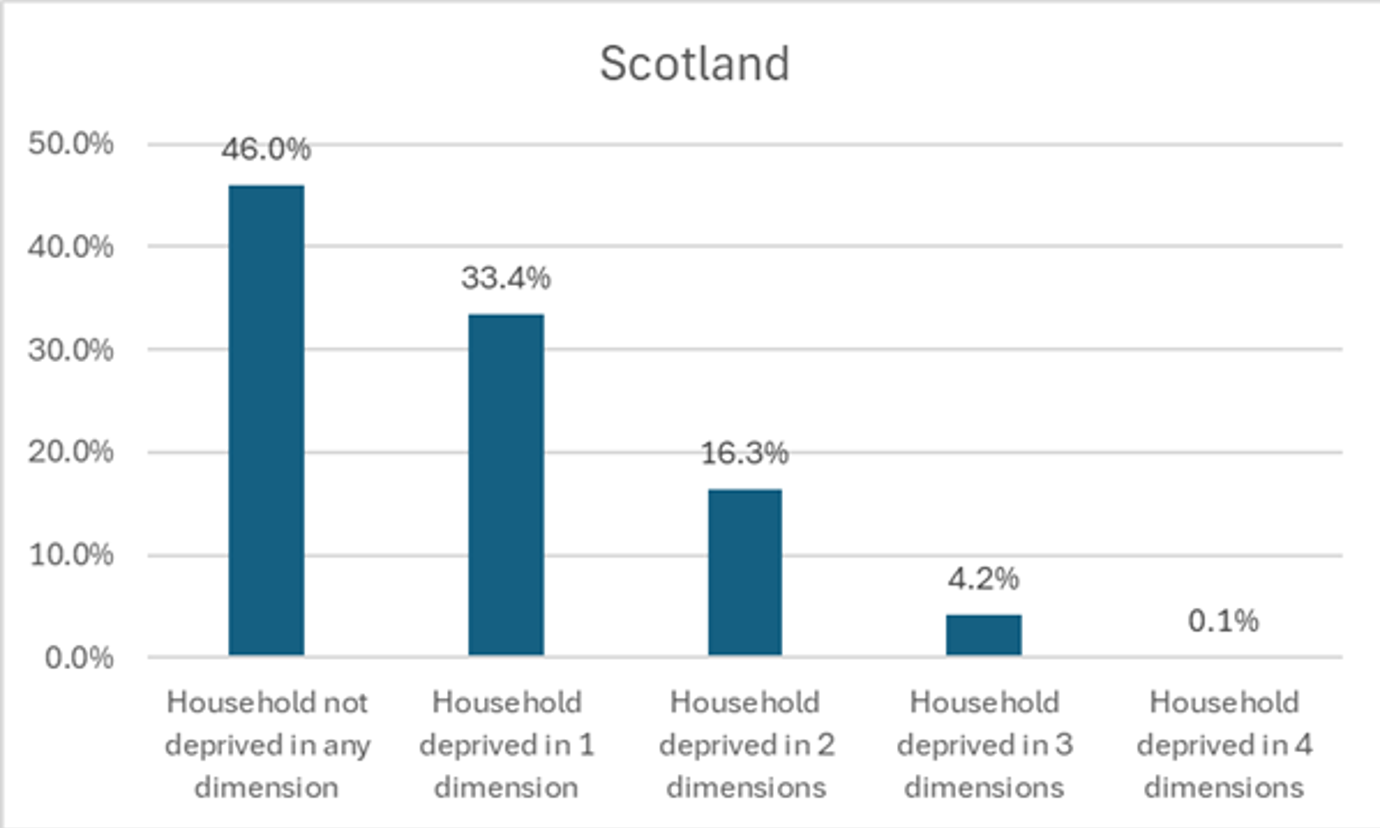
Figure 10: the percentage of households in England deprived in one, two, three or four dimensions and the percentage of households in England not deprived in any dimension.
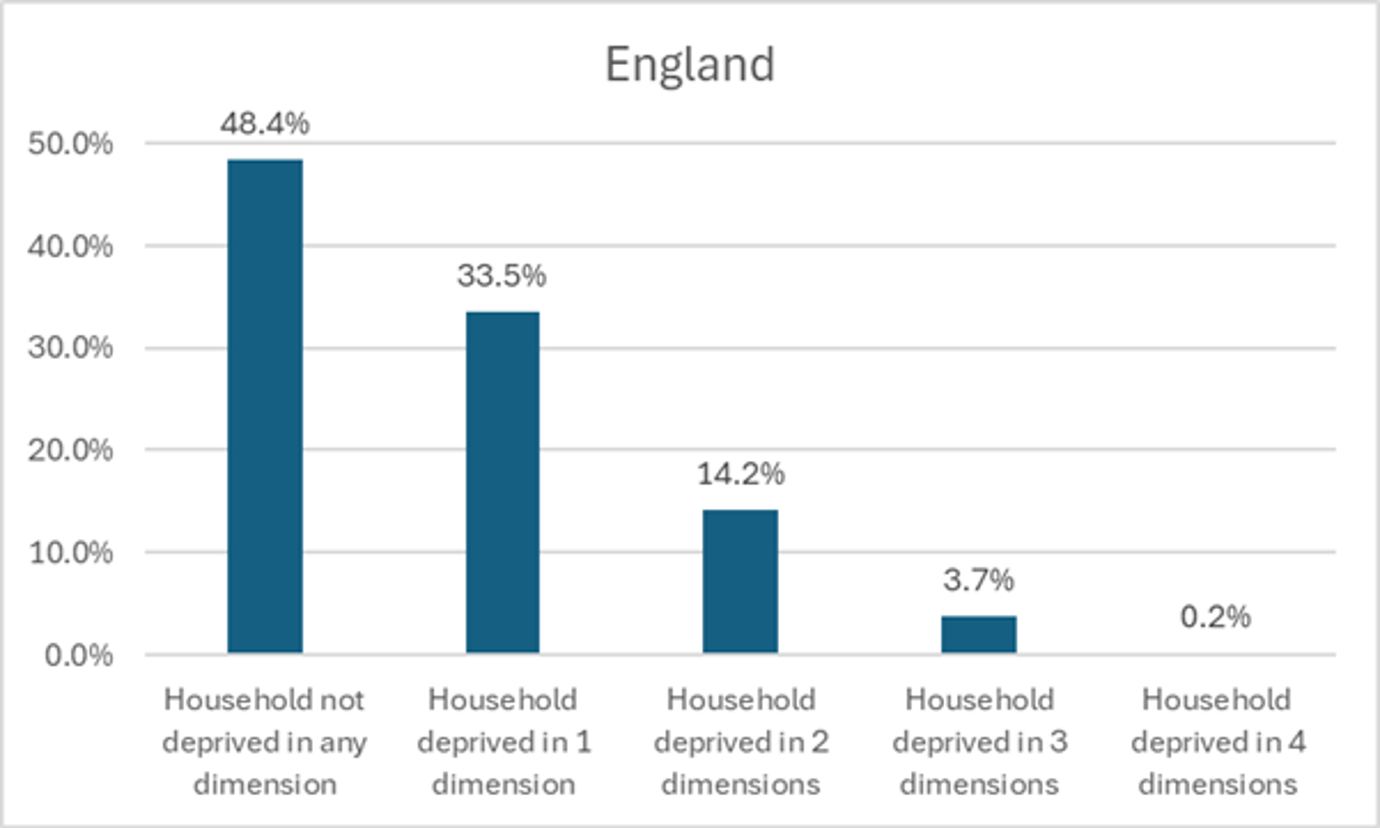
Figure 11: the percentage of households in Wales deprived in one, two, three or four dimensions and the percentage of households in Wales not deprived in any dimension.
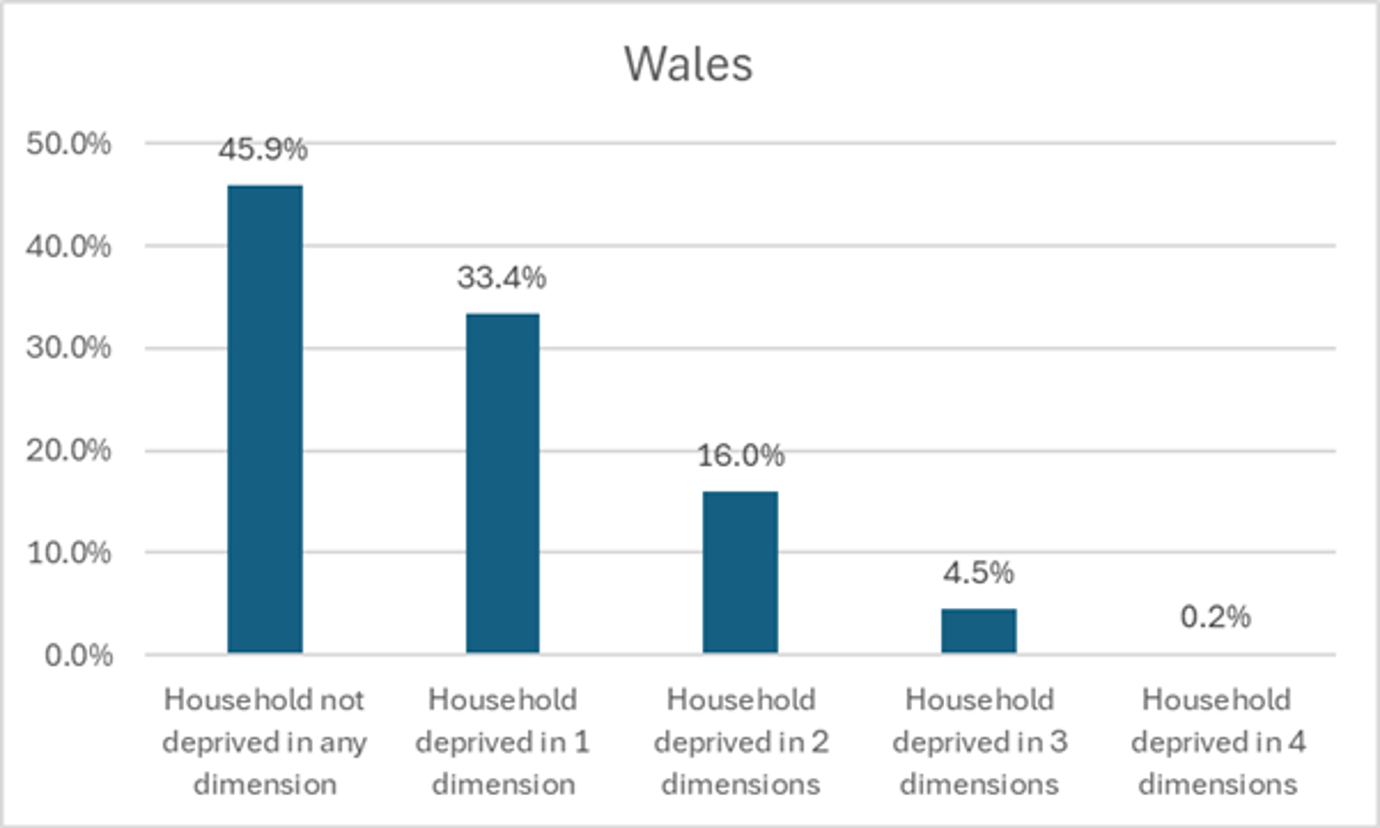
Figure 12: the percentage of households in Northern Ireland deprived in one, two, three or four dimensions and the percentage of households in Northern Ireland not deprived in any dimension.
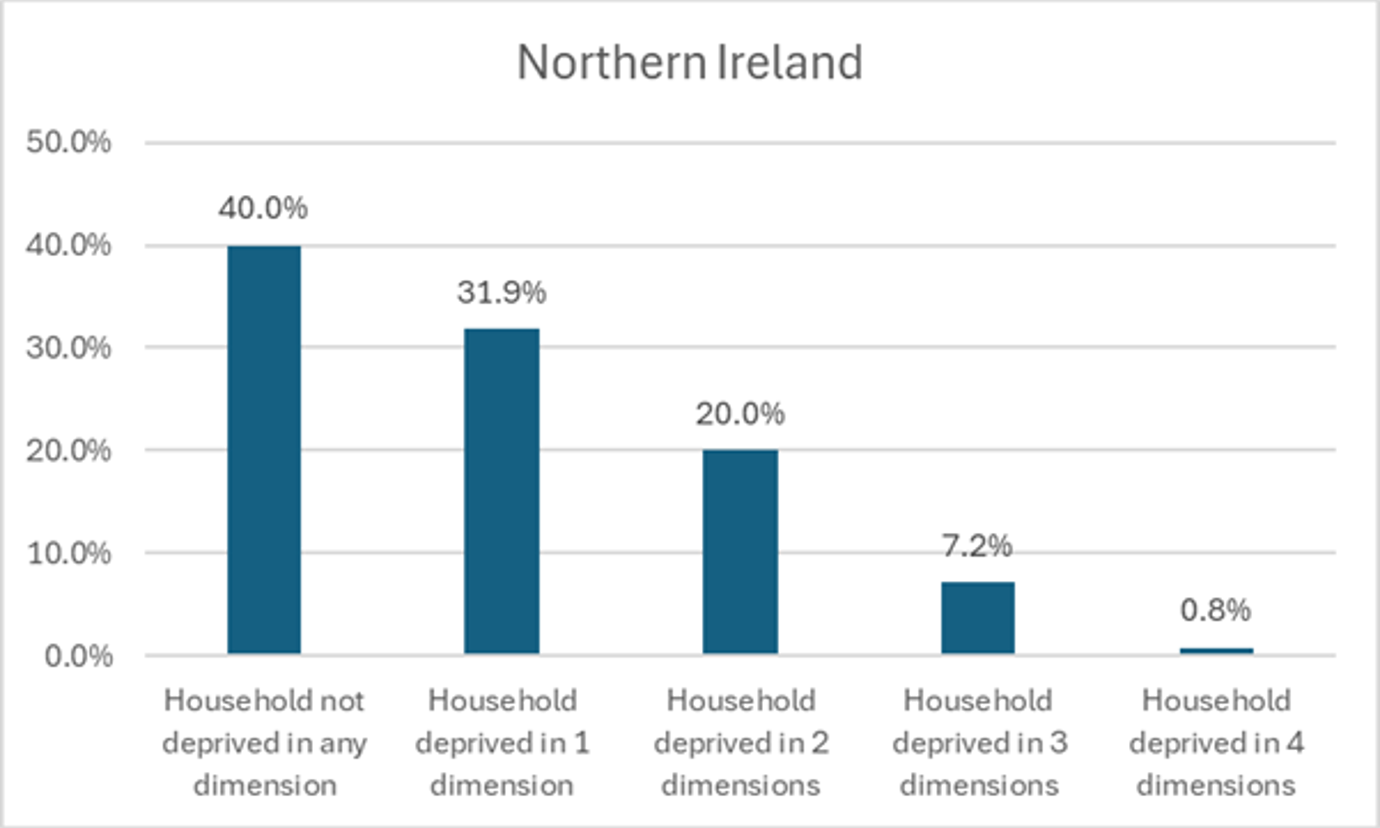
Figures 9, 10, 11 and 12 show the percentage of households not deprived in any dimensions and those deprived in 9, 10, 11 and 12 dimensions in Scotland, England, Wales, and Northern Ireland. Scotland has a lower percentage of households that were not deprived in any dimension (46.0%) than England and a higher percentage than Wales (45.9%) and Northern Ireland (40.0%).
Comparison with SIMD
The Scottish Index of Multiple Deprivation (SIMD) is a relative measure of deprivation across 6,976 small areas (called datazones). If an area is identified as ‘deprived’, this can relate to people having a low income but it can also mean fewer resources or opportunities. SIMD looks at the extent to which an area is deprived across seven domains: income, employment, education, health, access to services, crime and housing.
SIMD covers a broader range of dimensions of deprivation patterns than Census household deprivation data. The SIMD index has been calculated in different ways over time therefore it cannot be used directly to look at changes over time. SIMD is specific to Scotland and cannot be used for UK comparisons.
The Census household deprivation indicator can be constructed for a range of geographies down to output area, therefore it can be useful for picking up smaller pockets of deprivation, such as those in rural areas. It is also a direct measure of deprivation at household level and allows comparison between areas in terms of the proportion of households experiencing deprivation across the four dimensions. It allows for direct comparisons across the UK, offering a broader perspective on household-level deprivation trends. Unlike SIMD, it has remained consistent over time, making it particularly useful for tracking changes since the 2011 Census.
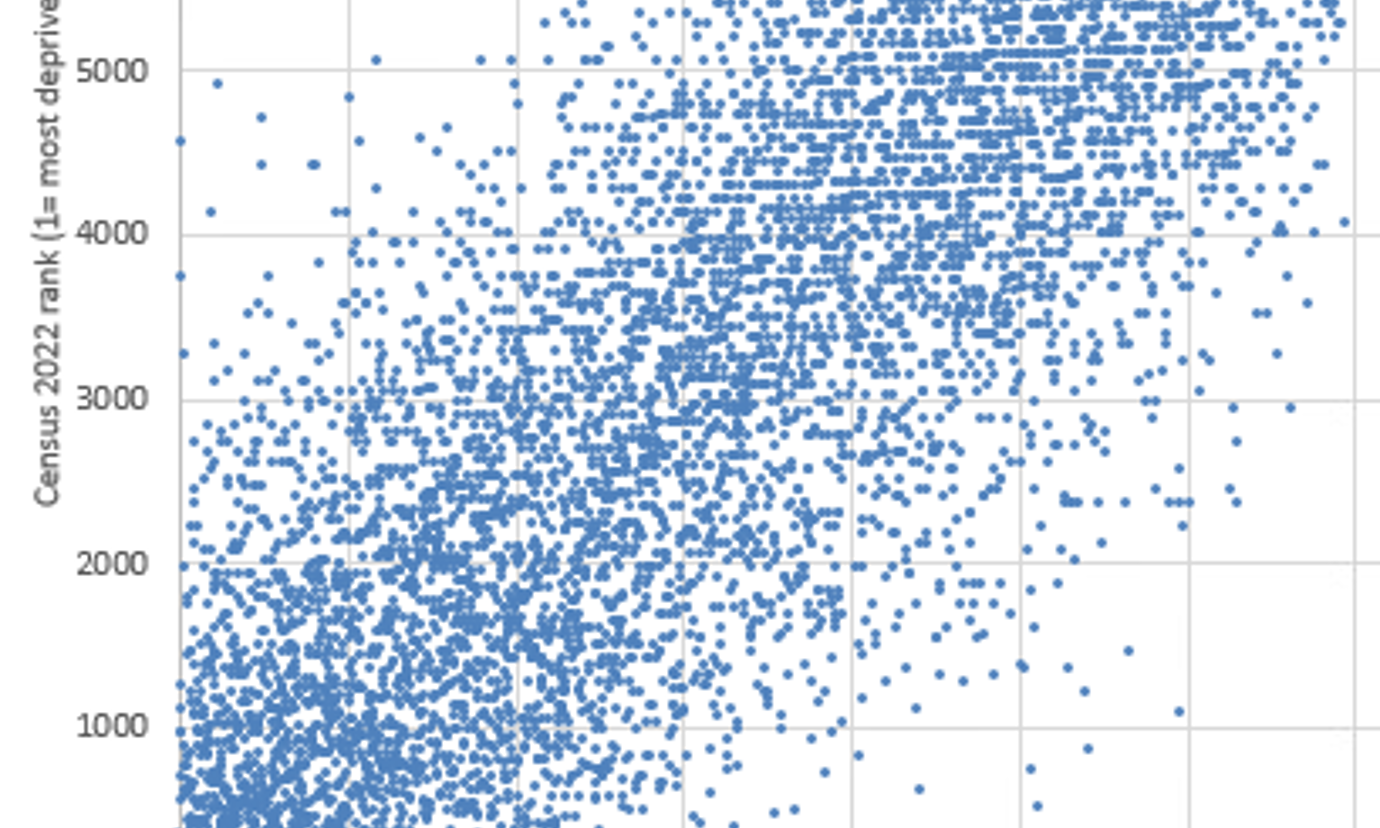
Figure 13 shows the ranking of each datazone on the proportion of households experiencing deprivation in two or more Census deprivation indicators. The datazone with the highest proportion of households that are deprived in at least two dimensions is assigned a rank of 1, second highest a rank of 2 and so on. These rankings are plotted against each area’s SIMD 2020 rank, showing a strong relationship between the two sets of data, though there are a some areas that don't follow the pattern. The majority of areas that don’t follow the pattern were rural areas.
Figure 13: Rank of 2011 datazones based on their proportion of households that are deprived on two or more of the Census 2022 deprivation indicators, by SIMD 2020 rank
Working with Census Based Indicators of Deprivation
When analysing the household deprivation in one, two, three or four dimensions there might be some limitations which one might consider. The household deprivation indicator measures deprivation collectively across the household rather than individually and therefore can class a household as being deprived if only one member of the household meets the criteria. This is illustrated in the examples below:
Example: Health and Disability Deprivation
If a household consists of three people – two adults in good health and one individual who has self-reported “bad” or “very bad” health or has a long-term health problem – when using household deprivation dimension definition, the entire household will be classified as deprived in the health and disability dimension, even though the other members of the household are in good health. The deprivation measure applies to the households, not just the individual affected.
Example: Education Deprivation
If a household has three adults, two of whom hold a Level 2 qualification or higher, but one person in the household does not have a Level 2 qualification and is not a full-time student, when using household deprivation dimension definition, the entire household will be classified as deprived in the education dimension, despite the fact that other members in the household are not deprived in this domain.
While measuring household deprivation has some limitations, it can become more meaningful when looking at households deprived in three or four dimensions. For example, a household classified as deprived in education only might still have all members who are employed, in good health and with adequate housing. However, when a household is deprived in three or four dimensions, it is more likely that multiple members within the household are experiencing deprivation.
Data related to this release
Search for Scotland’s Census 2022 data tables in the census data section.
Geography boundaries and lookups for use with census data are available on the NRS website.
Privacy protection
All data tables have privacy protection applied to keep the data of individuals safe. Cells might not sum to sub totals and totals due to these Statistical Disclosure Controls (SDC). More information about SDC is available via the slides from our May 2024 webinars.
Working with census statistics
Census statistics represent the total population rather than just those who completed the questionnaire. Since the 2001 censuses, statistical modelling has been used across the United Kingdom to produce total population estimates from census responses.
As with all estimates, there is a level of uncertainty. Users should consider uncertainty when working with census estimates and interpreting small changes.
More information on quality
The quality of census data is important. We made innovative changes to our approach to account for the census response rate (89.8%) and ensure census statistics represent the total population rather than just those who completed the questionnaire.
We published a blog on the quality of small area statistics and why you can be confident using census data.
Quality assurance
We have published quality information for the variables included in this release alongside this report.
In 2023 we published a report on our approach to statistical quality assurance alongside the first release of data from Scotland’s Census 2022. We have carried out extensive quality assurance work to produce high quality census estimates.
Rounding
This report uses rounded estimates. Figures may not add exactly to totals because of the rounding. Unrounded census data is used to calculate percentages.
An Accredited Official Statistics publication for Scotland
These official statistics were independently reviewed by the Office for Statistics Regulation in September 2023. They comply with the standards of trustworthiness, quality and value in the Code of Practice for Statistics and should be labelled ‘accredited official statistics’.
Future census publications
We will publish outputs from Scotland's Census 2022 in phases. This reflects the additional work required to produce more detailed census statistics.
Topic summaries
This report is the fifth in a series of topic summaries. The remaining summaries are:
- Education, labour market and travel to work (11 September)
- Health, disability and unpaid care (3 October)
The topic order above is provisional and release dates will be confirmed on our census outputs release schedule page.
Topic data will be published down to output area where possible. Output areas are made up of approximately 50 households. We will also produce breakdowns of these topics by age and sex where appropriate.
Multivariate/Build your own tables
After the remaining topic releases we will publish multivariate data. This means we will publish tables which include more than one census topic variable. For example, ethnic group by country of birth.
Our Flexible Table Builder will allow users to create their own census tables. Users will be able to combine the different census variables they are interested in.
Glossary
Age
A person's age on Census Day, 20 March 2022.
Council Area
There are 32 council areas in Scotland. Councils provide public services, including education, social care, waste management, libraries and planning.
Intermediate zones
Intermediate zones are a statistical geography. They sit between data zones and local authorities. There are 1,279 intermediate zones covering the whole of Scotland.
Household
A household is defined as:
- one person living alone, or
- a group of people (not necessarily related) living at the same address who share cooking facilities and share a living room or sitting room, or dining area
This includes:
- all sheltered accommodation units in an establishment (irrespective of whether there are other communal facilities), and
- all people living in caravans on any type of site that is their usual residence; this will include anyone who has no other usual residence elsewhere in the UK
A household must contain at least one person whose place of usual residence is at the address. A group of short-term residents living together is not classified as a household, and neither is a group of people at an address where only visitors are staying.
Household tenure
Whether a household rents or owns the accommodation they live in. For rented households, the census also captures information about the type of landlord who owns or manages the accommodation.
Household reference person (HRP)
An individual person within a household who is used as a reference point. The characteristics of this person are used to produce further statistics and about the household.
More information on how HRPs are chosen is available in the census metadata.
Overcrowding and under-occupancy
Overcrowding and under-occupancy information is calculated by looking at the difference between the actual number of bedrooms and the required number of bedrooms in each household.
The number of bedrooms required in each household is calculated using the bedroom standard which was introduced in the Housing (Overcrowding) Bill 46 (2003).
The bedroom standard indicates that for each household, each of the following groups or individuals requires a separate bedroom:
- any couple
- any person aged 21 years or more
- two people of the same sex aged between 10 and 20
- two children (whether of the same sex or not) under 10 years
- two people of the same sex where one person is aged between 10 years and 20 years and the other is aged less than 10 years
- any further person who cannot be paired appropriately.
An occupancy rating of -1 means that a household has one fewer bedroom than required. A rating of +1 means that they have one more bedroom than required.
Communal establishment
An establishment providing managed residential accommodation. Examples include care homes, student halls of residence and defence establishments.
2011 Datazones
2011 Datazones are small geographical units created using population data from the 2011 Census. Datazones are statistical geographies used to produce small area statistics at a local level. They are designed to have a population between 500 and 1,000 people, making them small enough to describe communities while also being large enough to avoid disclosing personal information.
They serve two main functions in the production of official statistics. Firstly, they provide a standard, stable geography for the production and publication of statistics at a local area across a wide range of topics including Scottish Index of Multiple Deprivation 2020 Rank and Census-based Deprivation Indicators. Secondly, aggregations of datazones can be used to provide estimates for higher-level geographies where official statistics might not otherwise be available.
SIMD 2020 Rank
The Scottish Index of Multiple Deprivation (SIMD) 2020 ranks areas based on multiple indicators of deprivation including income, employment, health, education, access to services, crime, and housing. These ranks were calculated using the 2011 datazone boundaries.
Census Household Deprivation Indicator
Scotland’s Census 2022 provides the most up-to-date household deprivation indicator data. The analysis compares the Census 2022 household deprivation indicators to SIMD 2020 ranks, both mapped to 2011 datazone boundaries. This helps to compare SIMD 2020 ranks with the Census 2022 household deprivation indicator, and may provide insight into whether households currently experiencing multiple forms of deprivation are still concentrated in areas previously identified as deprived. However, caution is needed when making comparisons, as SIMD 2020 and the Census household deprivation indicator are calculated differently, using distinct methodologies and sources of data.
UK censuses
The Office for National Statistics is responsible for the census in England and Wales. Data and supporting information is available on the ONS website.
The Northern Ireland Statistics and Research Agency is responsible for the census in Northern Ireland. Data and supporting information is available on the NISRA website.
Contact us
Please get in touch if you need any further information, or have any suggestions for improvement.
E-mail: [email protected]
NRS customer services telephone: 0131 202 0451
Join our mailing list
If you would like to receive updates about census statistics get in touch via our contact us page.
© Crown Copyright 2024 SG/2024/154