Scotland's Census 2022 - Coverage Adjustment Methodology
1. Introduction
1.1 Background
For over 200 years, Scotland has relied on the census to underpin national and local decision making. It provides anonymous census estimates which offer a highly accurate picture of the number of people and their characteristics (such as age, health, where and how we live, etc.). National and local government, the education and academic communities, the third sector, commercial business and other use the census information in order to plan and provide their operations efficiently and effectively. The information is particularly important when there is no other reliable source or when the ability to cross-reference or compare multiple characteristics of people or households is required.
While the census aims to capture details of the whole population of Scotland, it is always expected in any census that some people and households will not submit a return. To mitigate for this we use estimation methods to adjust for this undercount at both household and individual level, creating estimated population totals for various geographic and demographic groups. To produce a final complete and consistent dataset including individual and household records for the missing population, we use a process called Coverage Adjustment. The difference between the census count from returns and the census estimates gives us the shortfall of records that the process needs to create.
Coverage Adjustment consists of two main steps – firstly selecting the households and people (“donors”) to be added to the census dataset, and secondly placing those households and people geographically in the data.
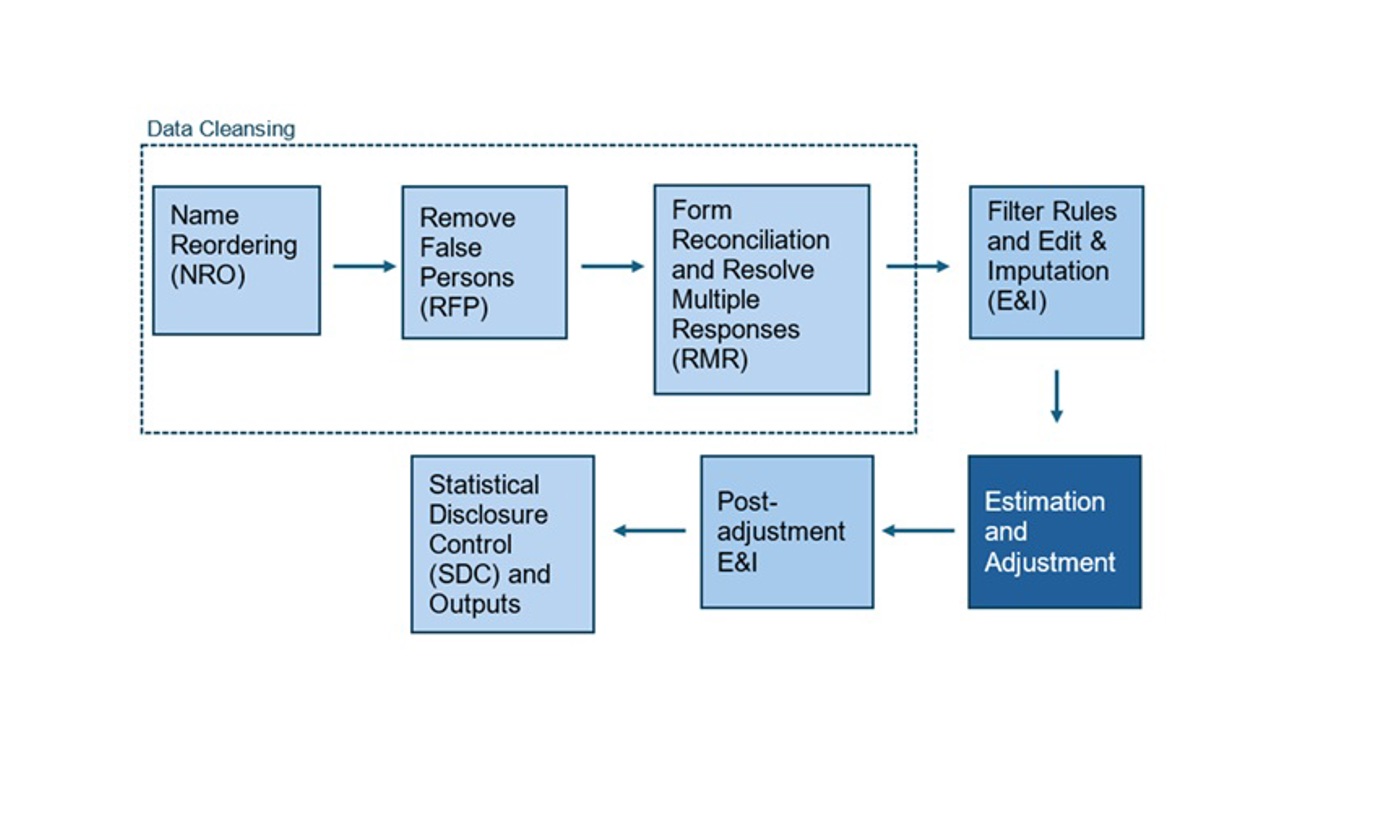
Adjustment is part of the fifth step of the census data processing journey.
1.2 Lower than expected response rate
Scotland’s Census 2022 had a target person response rate of 94% nationally, with management information on household return rates used as a proxy during the live operations to measure progress. The final household return rate was 89%.
With a lower response rate, the coverage adjustment process would need to create a larger number of records than planned in the dataset. To enhance the quality of these newly created records, we made two changes to our methodology:
· We changed the donor selection methodology from a logistic regression model with iterative calibration with our census estimates, to a combinatorial optimisation system developed by the Office for National Statistics (ONS)
· We used administrative data to supplement the donor records, and to supplement the household spaces in placement.
2. Changes to Adjustment
2.1 Adjustment in 2011
The planned approach to coverage adjustment was based on that used in 2011, which entailed logistic regression modelling to provide probabilities of being missed in census, followed by donor selection and placement. All three stages were run separately for individuals before being run for households.
The methods detailed here only cover people living in households. A separate process was used for Communal Establishment residents. The methodology for CE adjustment can be found here.
2.1.1 Stage 1 – Modelling Probabilities with Characteristics
The first stage of the process was to model the likelihood of households and persons being missed from the census. This logistic regression model used the links between the census and the Census Coverage Survey (CCS) to predict the probability of an individual being counted in the census based on the individual’s characteristics such as age, sex, marital status, ethnicity and economic activity.
The model provided probabilities for people missed within households (when the household responded, but a given individual was not included) and wholly missed households. Only variables included on both the census and CCS were used in the model.
These probabilities were then converted in to coverage ‘weights’ by taking the reciprocal of the probability (for example, a person with a 50% probability of being counted in the census would have a weight of 2 people). These weights were then calibrated to the population estimates at Local Authority level from the Estimation process.
2.1.2 Stage 2 – Selection of Missed Households and People
In the second stage, individual records were first selected based on the weights calculated from the probability of being missed within responding households. These records were then placed into existing households that had submitted census returns.. After placement of the individual records in existing households, the modelling and selection process is repeated but for whole households.
The records were ordered based by weight, calculating a cumulative total of the actual count and weighted count for each record. When the weighted count exceeded the actual count by a whole person, then that record was selected to have a copy created as a new ‘skeleton’ record. These skeleton records carried over the key characteristics used in the modelling, but dropped other variables that were then imputed at a later stage (Edit and Imputation).
2.1.3 Stage 3 – Placement of Synthetic Households and People
In the final stage the synthetic persons and households are placed in to a new location within the Local Authority.
After the selection of the people missed from existing households, these records were placed in to households that responded to the census. A score was calculated to evaluate the similarity of the household a record came from, and all potential recipient households – for example if a child was selected from a four-person household which also contained a mother, father and young child, then a likely candidate would be a three-person household of this type.
Once the person placement was completed, then the modelling was run on the household level with these new people included, and the selection of synthetic households is made. Where possible, these synthetic households were be placed in to addresses where a household is believed to exist but there was not a complete census return received. These included addresses where a census field enumerator believed the address was occupied, census questionnaires that were returned blank and census questionnaires where only the household questions were completed. A score was calculated based on the similarity (in terms of accommodation type and household tenure) between each synthetic household and the potential locations it could be placed to provide the best placement possible.
Where there was no suitable location for the household, a synthetic address was created and allocated to a postcode in order to give it a geographical reference.
2.2 Changes to Donor Selection
As the number of records to be created by the adjustment process was larger than originally planned, there were two primary changes to donor selection that we made – using admin data where possible to reduce the number of records to be created from other census records, and switching to a Combinatorial Optimisation method to choose the census records to make copies of.
2.2.1 Addition of Administrative Data
The administrative data spine developed for Estimation was used as a starting point.
Further information on the Estimation process can be found here, and the creation of the administrative data spine here. Only records that did not appear on the census – either as individuals or where the household had responded to the census already – were selected for inclusion. These were filtered down to the records that we were most confident in, using a strength of evidence variable based on how many data sources each record appeared on. An imputation process imputed the characteristics needed in Adjustment that did not appear on the admin data. The age and sex were also imputed based on the distribution of ages within records that linked between admin data and census data. For example, if someone was 30 in the administrative data, we assigned them an age based on the distribution census ages for all records with an admin data age of 30.
We did not want to reach any of the shortfalls from estimation entirely using admin data, and potentially make the later donor selection process more difficult by constraining it. For example, if all administrative records had been added, there could be a situation where the remaining household shortfalls were only in large household sizes, but the remaining person shortfalls were all in older demographics (who tend not to live in large households). Batches of admin data households were selected and added iteratively, checking how close this brought us to the estimation benchmarks, until any benchmark was half way to being reached.
Once all records were added, the remaining shortfall was calculated for input to the main Adjustment donor selection process.
2.2.2 Change to Combinatorial Optimisation
The method for selecting donors was changed to a Combinatorial Optimisation (CO) method developed by ONS for the England and Wales census in 2021. This involves an algorithm making a selection of households from the responding census data, in order to meet benchmark marginal totals suggested by a set of estimates produced from the Estimation process. This would select a collection of households in order to meet the shortfall in each characteristic as closely as possible – aiming to simultaneously meet the targets for age-sex group, economic activity, ethnicity, household size, household tenure and hard to count index within each local authority.
The CO method was found to produce set of records to add the census dataset which was much closer to the estimation benchmarks than those achieved by the previous method from 2011. The 2011 method also could have problems when the calibration stage would not converge to a final set of probabilities without further collapsing of the variables or removal of some variables entirely from the calibration process. This method would only select whole households to add to the dataset, rather than adding any individuals to households that already responded to the census.
The selection process was made 500 times, to produce 500 different combinations of households to meet the estimation benchmarks. The absolute error was calculated as the difference between the benchmark target and the produced number in the selected combination of households for each variable category. The values for each variable were summed together to produce the Total Absolute Error (TAE), and summed across all variables to produce the Overall Total Absolute Error (OTAE). The proportion of selected households that were from a unique donor household was also calculated. Each of these measures were used to decide on which run was the best run.
Minimising the OTAE ensures that the final dataset will be as close as possible to the estimates for each variable, with the TAE for age-sex group aiming to be small if not zero. Minimising the proportion of unique donor households ensures that there will not be high levels of the same household being duplicated multiple times, which risks producing spikes in the particular characteristics of the individuals within the household.
1.1 Changes to Placement
The placement stage of the process worked similarly as to in 2011, but the potential addresses for use in placement were assembled from different sources. As well as the information collected during field work visits, any addresses from admin data that were considered appropriate for use in the earlier stage but that were not ultimately used were added to the pool of potential addresses for placement.
3. Adjustment process report
The following section details the outcome of the run of the process used to produce the census outputs.
3.1 Data preparation
The following variables were used as benchmarks for the CO method: age-sex group, ethnicity, activity last week, household size, household tenure and hard to count index.
The variables were collapsed as detailed in the accompanying Estimation paper.
3.2 Combinatorial Optimisation report
48,200 household records with 84,200 individual records were added to the Census dataset from administrative data.
The process then selected 204,800 household records to the dataset with 421,300 people to be added to the dataset, which were chosen from 145,400 unique households.
3.3 Placement report
200,000 of these households were placed within existing addresses in placement, while the remaining 4,900 were placed in to a non-specific address within a postcode.
The records that were added only retained the original values of the following variables: Age, sex, term time indicator, economic activity last week, major ethnicity group, full-time student indicator, marital status, relationships within household, country of birth.
All other variables were imputed through a second run of the Edit and Imputation (E&I) process. The methods for E&I are described here.
4. Conclusion
This paper has discussed the changes to coverage adjustment methodology implemented due to the lower than expected response rate, as well as outlining existing methodology and reporting on the outcome of this process.
The primary changes were the switch to a Combinatorial Optimisation method for the selection of donor records to be replicated within the final dataset, and the inclusion of admin data directly to the dataset in order to reflect non-respondents and its use to add potential addresses for the new households to be placed in.
All our methods, as well as their implementation, have been through extensive peer review, including approval from our international steering group to whom we are very grateful to for their help and advice. We would also like to thank ONS for their support and assistance in adapting their methodology.