Quality Assurance report - Household deprivation indicator
Background
This report accompanies the publication of Scotland’s Census 2022 data on household deprivation. Deprivation is a complex subject area and official statistics such as the Scottish Index of Multiple Deprivation already exist. Census data is unique in that it can indicate deprivation at household level, rather than at an aggregate geographic level. This quality note discusses the coherence of a census-based indicator to equivalent indicators derived from census data for the rest of the UK as well as area-based measures like the Scottish Index of Multiple Deprivation.
How is household deprivation calculated?
Household deprivation in Scotland’s Census 2022 is measured by assessing whether a household is deprived in one or more of four dimensions. These dimensions are:
1. Employment – A household is deprived if there is at least one person in the household aged 16 and over who is not a full-time student and is either unemployed or economically inactive due to long-term sickness or disability.
2. Education – A household is deprived if no person aged 16 and over has at least Level 2 qualification (e.g. SCE Higher, Advanced Higher, or equivalent), and no person aged 16-18 is in full-time education
3. Health and Disability – A household is deprived if any person in the household has general health that is ‘bad’ or ‘very bad’ or has a long-term health problem
4. Housing – A household is deprived if the accommodation is either overcrowded (fewer bedrooms than required under the bedroom standard), in a shared dwelling or has no central heating.
Households are then assigned a deprivation score from 0 to 4, depending on how many dimensions apply.
Comparison with other UK census data
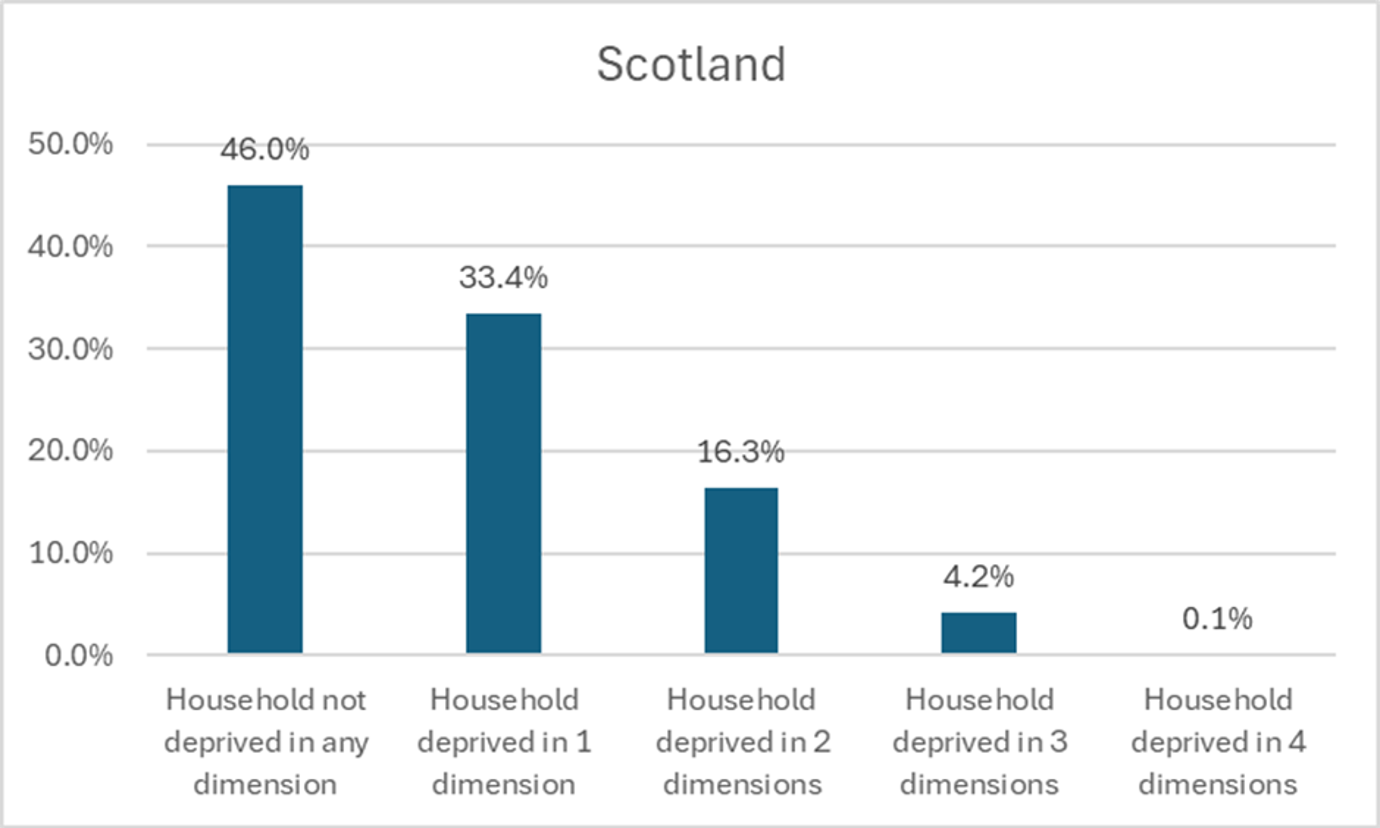
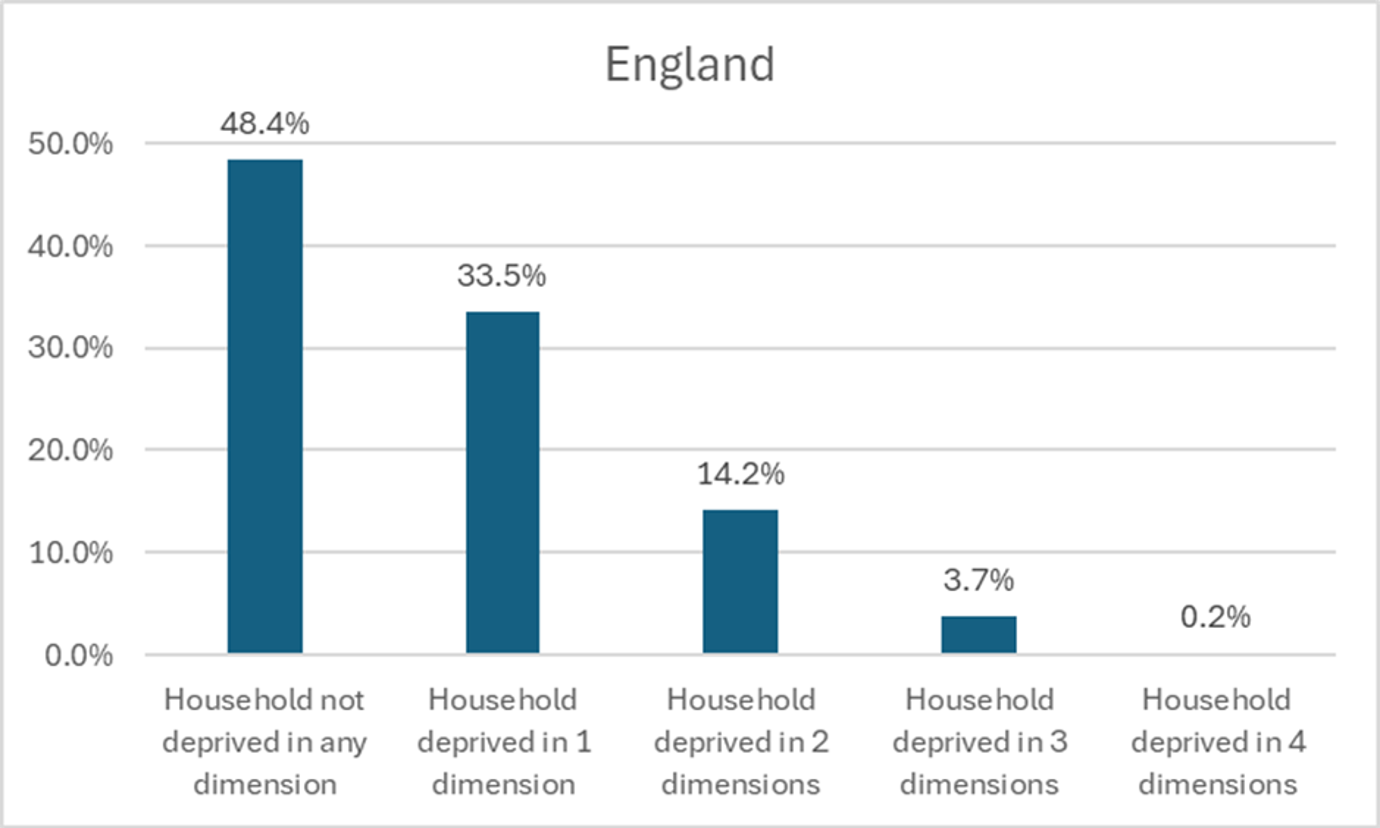
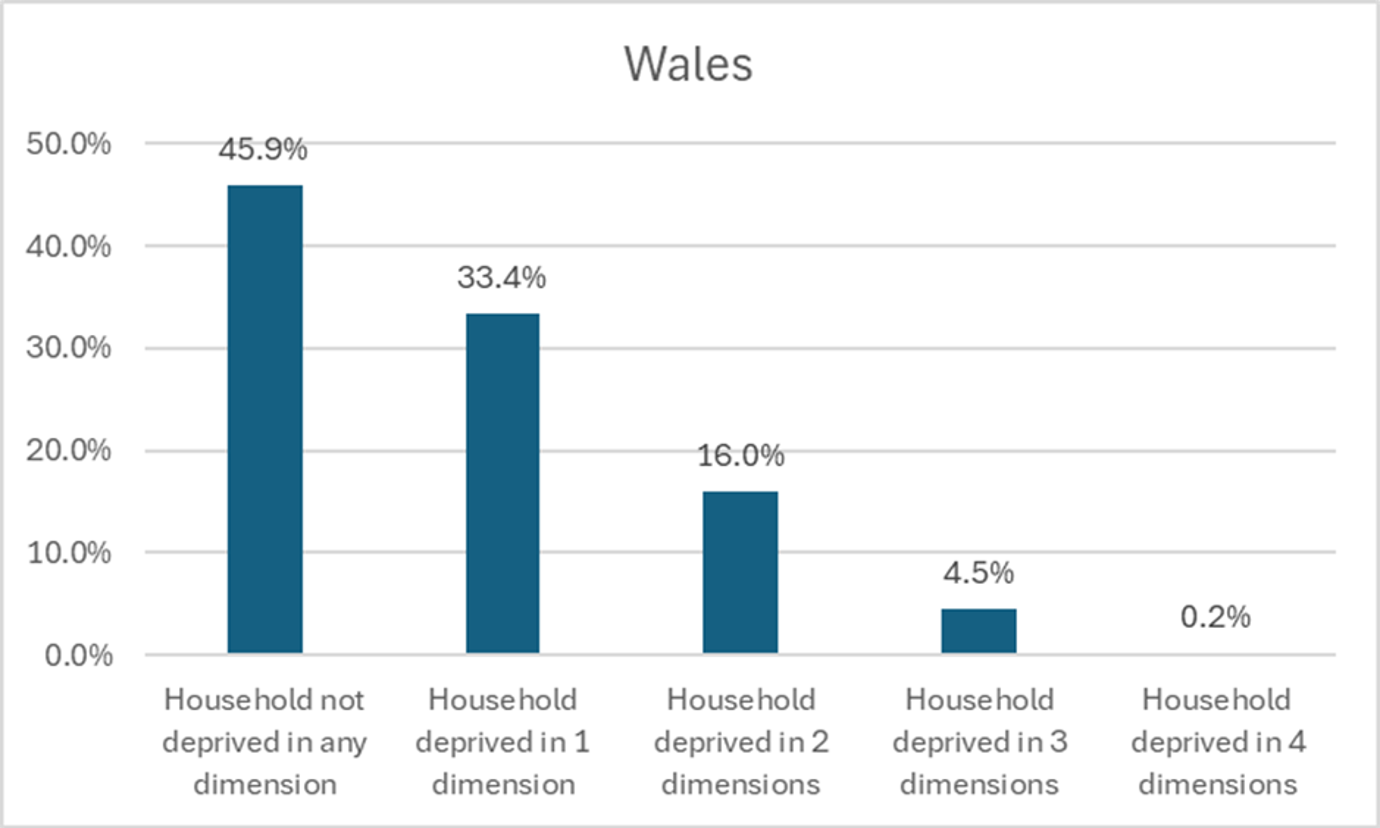
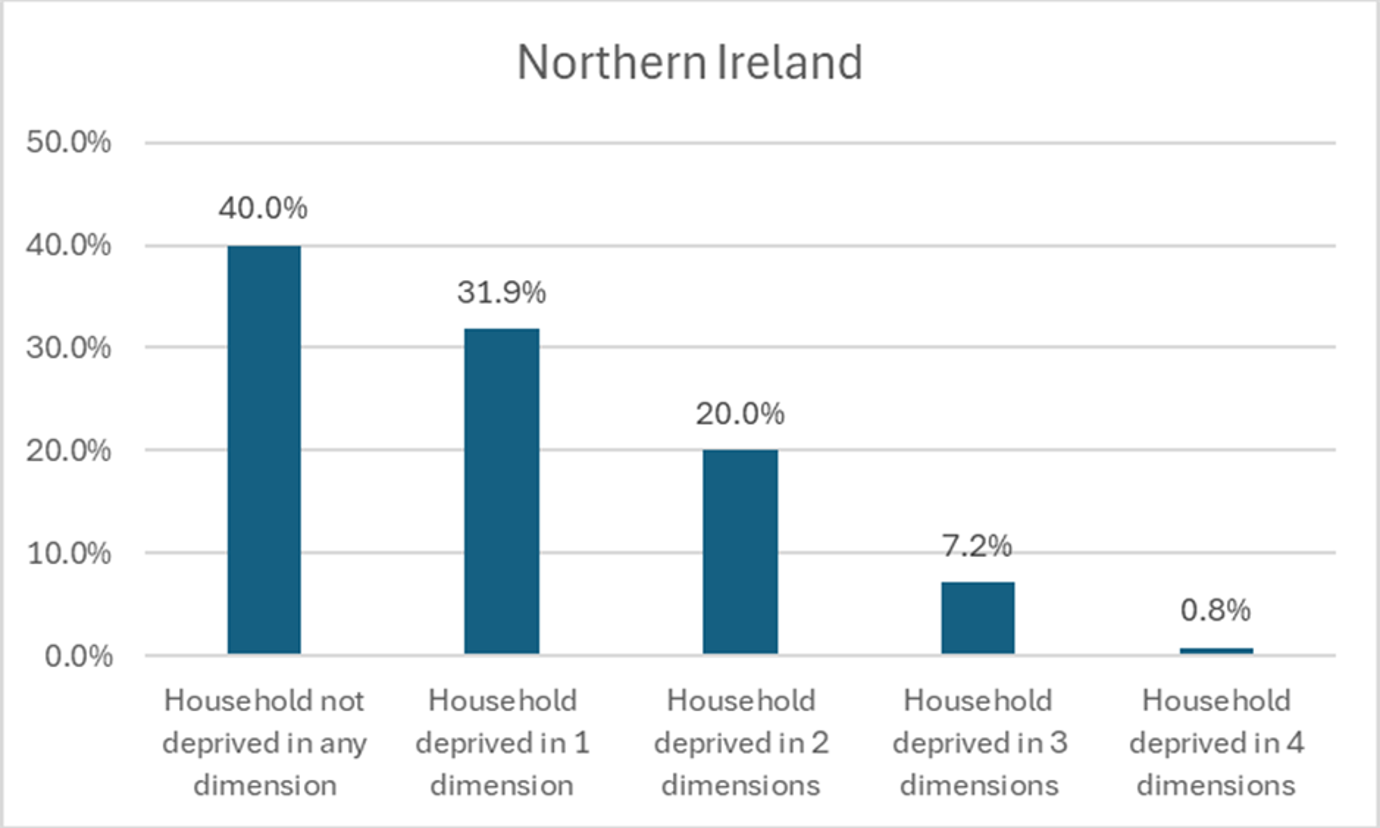
Figures 1, 2, 3 and 4 show the percentage of households not deprived in any dimensions and those deprived in 1, 2, 3 and 4 dimensions in Scotland, England, Wales, and Northern Ireland. Scotland has a lower percentage of households that were not deprived in any dimension (46.0%) than England and a higher percentage than Wales (45.9%) and Northern Ireland (40.0%).
Comparison with SIMD
The Scottish Index of Multiple Deprivation (SIMD) is a relative measure of deprivation across 6,976 small areas (called datazones). If an area is identified as ‘deprived’, this can relate to people having a low income but it can also mean fewer resources or opportunities. SIMD looks at the extent to which an area is deprived across seven domains: income, employment, education, health, access to services, crime and housing.
SIMD covers a broader range of dimensions of deprivation patterns than Census household deprivation data. The SIMD index has been calculated in different ways over time therefore it cannot be used directly to look at changes over time. SIMD is specific to Scotland and cannot be used for UK comparisons.
The Census household deprivation indicator can be constructed for a range of geographies down to output area, therefore it can be useful for picking up smaller pockets of deprivation, such as those in rural areas. It is also a direct measure of deprivation at household level and allows comparison between areas in terms of the proportion of households experiencing deprivation across the four dimensions. It allows for direct comparisons across the UK, offering a broader perspective on household-level deprivation trends. Unlike SIMD, it has remained consistent over time, making it particularly useful for tracking changes since the 2011 Census.
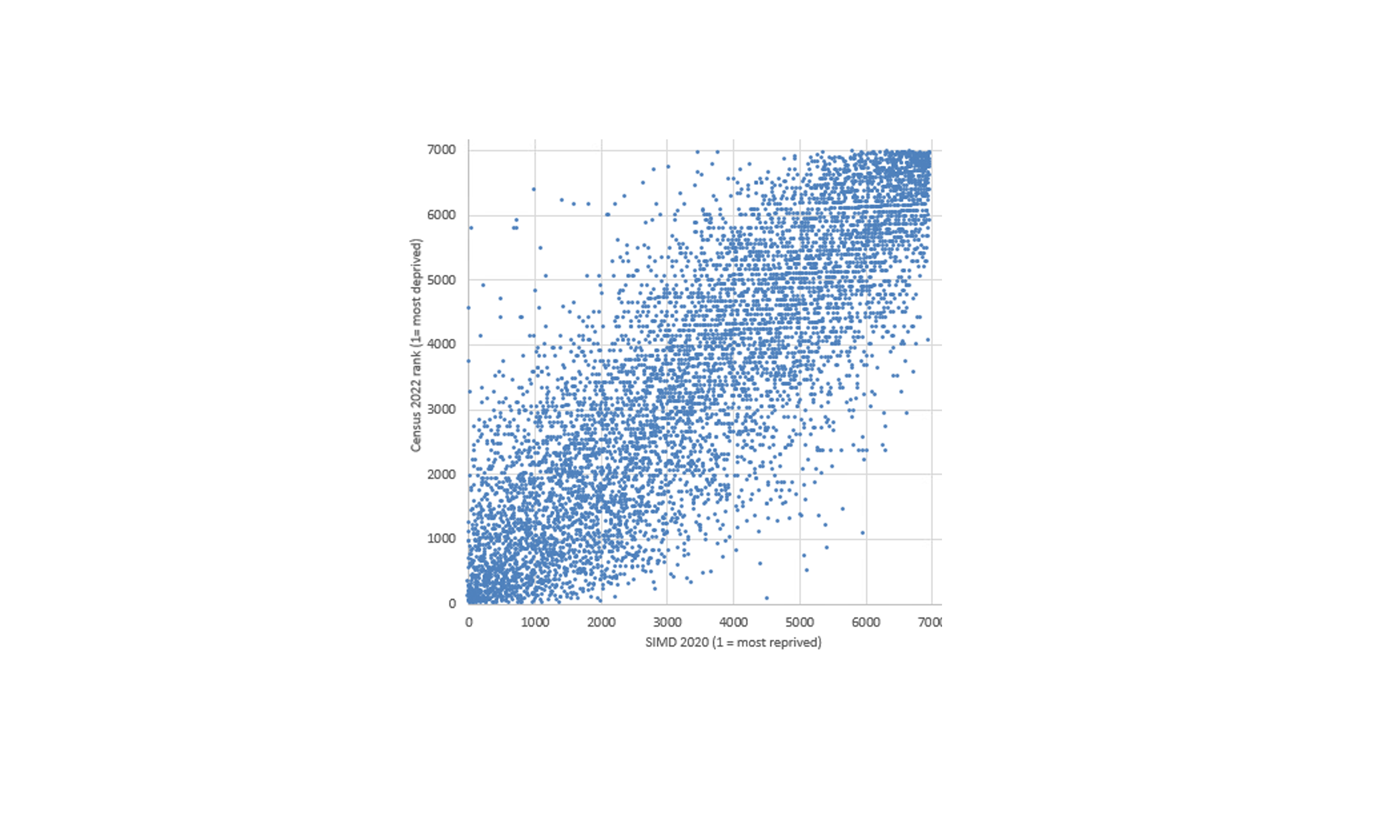
Figure 5 shows the ranking of each datazone on the proportion of households experiencing deprivation in two or more Census deprivation indicators. The datazone with the highest proportion of households that are deprived in at least two dimensions is assigned a rank of 1, second highest a rank of 2 and so on. These rankings are plotted against each area’s SIMD 2020 rank, showing a strong relationship between the two sets of data, though there are a some areas that don't follow the pattern. The majority of areas that don’t follow the pattern were rural areas.
Working with Census Based Indicators of Deprivation
When analysing the household deprivation in one, two, three or four dimensions there might be some limitations which one might consider. The household deprivation indicator measures deprivation collectively across the household rather than individually and therefore can class a household as being deprived if only one member of the household meets the criteria. This is illustrated in the examples below:
Example: Health and Disability Deprivation
If a household consists of three people – two adults in good health and one individual who has self-reported “bad” or “very bad” health or has a long-term health problem – when using household deprivation dimension definition, the entire household will be classified as deprived in the health and disability dimension, even though the other members of the household are in good health. The deprivation measure applies to the households, not just the individual affected.
Example: Education Deprivation
If a household has three adults, two of whom hold a Level 2 qualification or higher, but one person in the household does not have a Level 2 qualification and is not a full-time student, when using household deprivation dimension definition, the entire household will be classified as deprived in the education dimension, despite the fact that other members in the household are not deprived in this domain.
While measuring household deprivation has some limitations, it can become more meaningful when looking at households deprived in three or four dimensions. For example, a household classified as deprived in education only might still have all members who are employed, in good health and with adequate housing. However, when a household is deprived in three or four dimensions, it is more likely that multiple members within the household are experiencing deprivation.
Annex Explanation of Key Terms and Concepts
2011 Datazones
2011 Datazones are small geographical units created using population data from the 2011 Census. Datazones are statistical geographies used to produce small area statistics at a local level. They are designed to have a population between 500 and 1,000 people, making them small enough to describe communities while also being large enough to avoid disclosing personal information.
They serve two main functions in the production of official statistics. Firstly, they provide a standard, stable geography for the production and publication of statistics at a local area across a wide range of topics including Scottish Index of Multiple Deprivation 2020 Rank and Census-based Deprivation Indicators. Secondly, aggregations of datazones can be used to provide estimates for higher-level geographies where official statistics might not otherwise be available.
SIMD 2020 Rank
The Scottish Index of Multiple Deprivation (SIMD) 2020 ranks areas based on multiple indicators of deprivation including income, employment, health, education, access to services, crime, and housing. These ranks were calculated using the 2011 datazone boundaries.
Census Household Deprivation Indicator
Scotland’s Census 2022 provides the most up-to-date household deprivation indicator data. The analysis compares the Census 2022 household deprivation indicators to SIMD 2020 ranks, both mapped to 2011 datazone boundaries. This helps to compare SIMD 2020 ranks with the Census 2022 household deprivation indicator, and may provide insight into whether households currently experiencing multiple forms of deprivation are still concentrated in areas previously identified as deprived. However, caution is needed when making comparisons, as SIMD 2020 and the Census household deprivation indicator are calculated differently, using distinct methodologies and sources of data.