Quality Assurance report - Health, disability and unpaid care
Background
This report accompanies the publication of Scotland’s Census 2022 health, disability and unpaid care topic data. It builds on the quality assurance reports published so far.
Information on imputation rates for this topic have also been published on the Scotland’s Census website.
Topic expert quality assurance panels
We invited analytical colleagues from the Scottish Government to participate in quality assurance panels on the health data. Panel sessions assessed the coherence of 2022 Census statistics with previously published census estimates for Scotland, England & Wales and Northern Ireland as well as with other available data on the topics. The panel concluded that there were no remaining quality concerns which required investigation before publication.
Age-standardisation
Age is a risk factor in health outcomes, as many illnesses/conditions occur more frequently as people get older. Age-Standardised Percentages (ASPs) allow for comparisons to be made in health outcomes between populations living in different geographical areas and over time that may contain different age structures. ASPs adjust observed rates for a health outcome (e.g. disability) to a standard population with a known age structure. This means that the populations being compared are adjusted to have the same age structure as the standard population, accounting for any differences in their age structure. ASPs therefore allow for comparisons to be made using a single figure which accounts for different age structures, without the need to present and compare age-specific percentages.
For example, Aberdeen City has a slightly higher raw percentage (observed count/population) of people with very good general health at 49.2% than Na h-Eileanan Siar at 48.7%. However, Aberdeen City has an ASP of 48.2%, lower than the ASP of 53.5% for Na h-Eileanan Siar. The raw percentage implies that the populations in both local authorities have similar health experiences/outcomes. Presenting the ASPs allows us to both identify the difference in health outcomes between Aberdeen City and Na h-Eileanan Siar and to say that this difference is due to prevalence of people with a very good general health, rather than a difference in the age of their populations.
More information on the method used to produce age-standardised estimates for this topic are available on the Scotland’s Census website.
Please note that some data in this report are not age-standardised because it was not possible to age-standardise published estimates from the Scottish Health Survey (SHeS) and Scottish Survey Core Questions (SSCQ). The age structure of the 2013 European Standard Population and Scotland’s population are very similar so any conclusions would be unlikely to change if age-standardised data were used.
Quality information
General health
Individuals are asked to self-assess their health by answering the question ‘How is your health in general?’ with the response options very good, good, fair, bad and very bad. Scotland’s Census took place in March 2022 when there were limited COVID related restrictions in place outside of health and social care settings. The impact of the pandemic may still have influenced people's perception of their health. The England & Wales and Northern Ireland censuses took place a year earlier, in a different phase of the pandemic when more restrictions were in place. Users should consider this when comparing results across the UK.
The Scottish Health Survey (SHeS) is an annual survey investigating the health of individuals living in private households. The survey topics vary year to year but always include questions on general health, unpaid care and long-term conditions. The adult responses contribute to the Scottish Survey Core Questions (SSCQ) dataset which aggregates survey responses to a set of core questions asked in the SHeS, the Scottish Household Survey and the Scottish Crime & Justice Survey.
The census data on general health can be compared with both the SHeS and the SSCQ for people aged 16 and over only. The SHeS (28%) and the SSCQ (30.1%) have lower estimates of people in very good health compared with 41.0% in census. Combining very good/good health, the survey estimates are more similar to census, with 70% in SHeS and 72.1% SSCQ, compared with 75.2% in census (Figure 1). Note that these data are not age-standardised.
The differences between the census and these sources may be partially due to the fact that the surveys are interviewer-led, so individuals can ask for clarification if any question is unclear. The SHeS also focusses exclusively on health meaning individuals are thinking deeply about their health when answering questions, rather than moving through a range of topics quickly whilst filling in the census. Indeed, among the three surveys that make up the SSCQ dataset, the SHeS consistently estimates poorer health than the other two surveys and this is attributed to the survey topic.
Unpaid Care
The data on unpaid care are broadly comparable between Scotland, England & Wales and Northern Ireland, although there were some small differences in the question and options included on the questionnaire that users should note when comparing results.
In Scotland, the question asked was ‘Do you look after, or give any help or support to family members, friends, neighbours or others because of either:
- long-term physical / mental ill-health / disability; or
- problems related to old age?’
This wording was slightly different to England & Wales and Northern Ireland, where the following question was asked: ‘Do you look after, or give any help or support to,
anyone because they have long-term physical or mental health conditions or illnesses, or problems related to old age?’
In Scotland and Northern Ireland, the following response options were presented:
- No
- Yes, 1 to 19 hours a week
- Yes, 20 to 34 hours a week
- Yes, 35 to 49 hours a week
- Yes, 50 or more hours a week
In England and Wales, the options were the same except instead of the ‘Yes, 1 to 19 hours a week’ category the following options were presented:
- Yes, 9 hours a week or less
- Yes, 10 to 19 hours a week
For people aged 16 and over, census estimates for the provision of unpaid care in census (13.5%) is lower than those in the 2022 SHeS (16%) and SSCQ (19.3%). As mentioned in the general health section, there are reasons that may explain these differences. In addition, we see the largest difference between census and the survey estimates is in the category 0-19 hours of care provision (Census 2022: 55% of people providing some unpaid care, SHeS 2018-2022: 69% of people providing some unpaid care), whereas estimates for provision of more substantial care are similar between the two sources. SHeS has an additional category of 0 to 4 hours of care; almost half of the 69% providing 0-19 hours are in this category (48%). This additional category may capture small acts of care (e.g. bringing in someone’s shopping) and likely contributes to the higher overall estimate for care provision in the SHeS.
Long-term health conditions
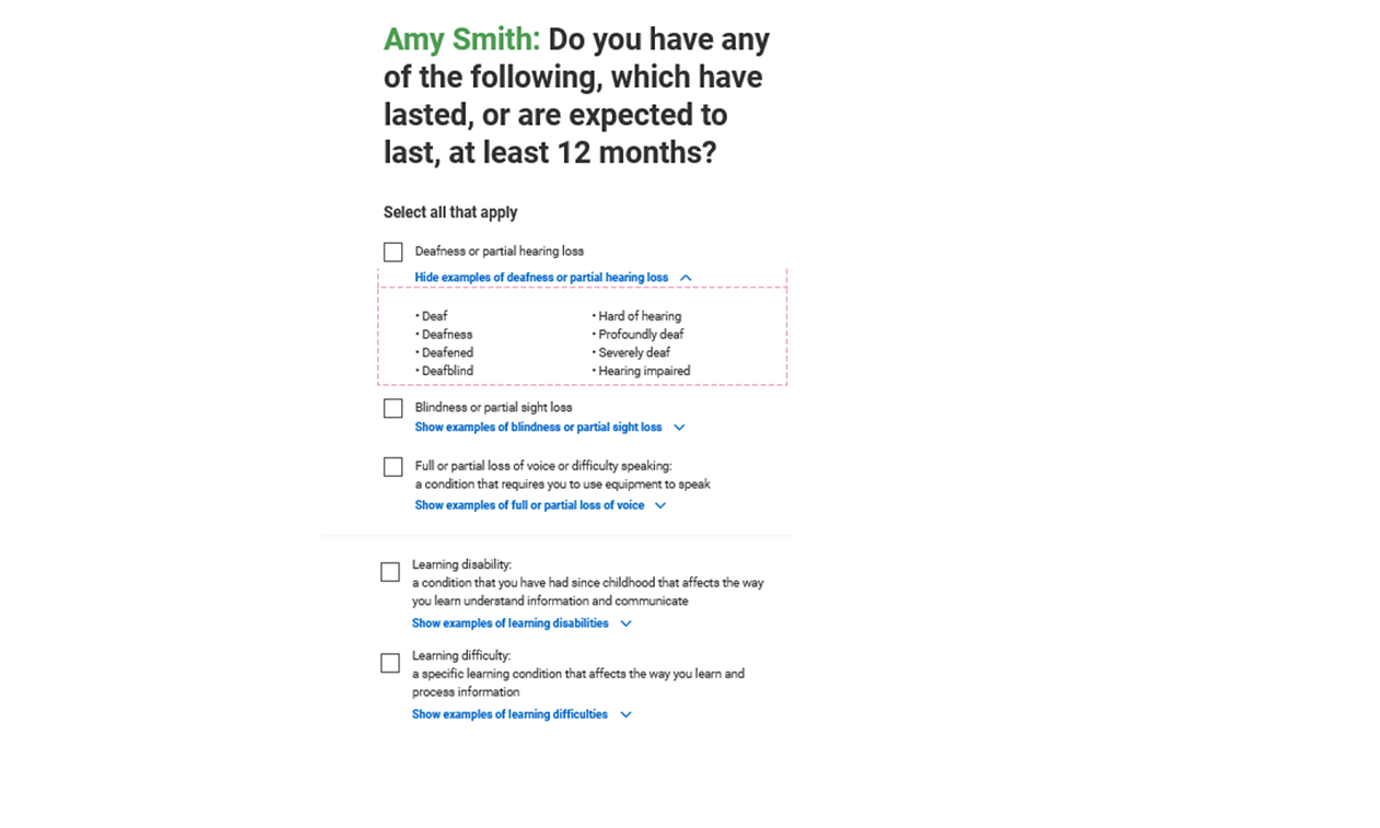
‘Do you have any of the following, which have lasted, lasting or are expected to last, 12 months or more?’. Respondents ticked which conditions they have from a list of nine options or filled in a write-in box which gets coded to one of the nine groups of conditions.
Scotland's Census 2022 long term health conditions question: Do you have any of the following which have lasted or are expected to last at least 12 months? (Tick all that apply)
- Deafness or partial hearing loss
- Blindness or partial sight loss
- Full or partial loss of voice or difficulty speaking (a condition that requires you to use equipment to speak)
- Learning disability (a condition that you have had since childhood that affects the way you learn, understand information and communicate)
- Learning difficulty (a specific learning condition that affects the way you learn and process information)
- Developmental disorder (a condition that you have had since childhood which affects motor, cognitive, social and emotional skills, and speech and language)
- Physical disability (a condition that substantially limits one or more basic physical activities such as walking, climbing stairs, lifting or carrying)
- Mental health condition (a condition that affects your emotional, physical and mental wellbeing)
- Long-term illness, disease or condition (a condition, not listed above, that you may have for life, which may be managed with treatment or medication)
- Other condition, please write in:
- No condition
Figure 2: Screenshot of online version of long-term conditions question
Respondents could tick multiple conditions on the questionnaire, meaning people with multiple conditions are counted in the relevant category for each condition they have. This means that users should not sum categories together to get a total for people with a long-term health condition.
The long-term conditions question changed between 2011 and 2022 with the addition of a new tick box to cover conditions involved with speech difficulty or loss of speech. In addition, following extensive consultation with users, descriptions were added next to each category to provide a clear definition for each condition (see question text above). If required, individuals could also access lists of the specific conditions via a drop-down box below each category on the online form (Figure 2).
In 2011 we received a lot of write-in responses to the long-term conditions question. Many of these were subsequently coded to one of the listed condition categories. This suggested that people were unsure what type of conditions were included in each of the main categories, so they decided to write their condition in.
In 2022 the descriptions added next to each category generally worked well. These changes halved the number of write-in responses provided in 2022 compared with 2011. However, the changes had an unintended impact on the learning disabilities, learning difficulties and developmental disorders categories.
Long-term conditions: Learning disability, learning difficulty and developmental disorder
For the learning disabilities, learning difficulties and developmental disorders categories, the change to the question between 2011 and 2022 was more substantial. These categories had examples next to the tick box in 2011, as shown below. Those examples were removed when adding the descriptions for 2022. As with the other categories, a list of the specific conditions included was provided via a drop-down box below each category.
Scotland's Census 2011 long term health conditions question: Do you have any of the following which have lasted, or are expected to last at least 12 months? (Tick all that apply)
- Deafness or partial hearing loss
- Blindness or partial sight loss
- Learning disability (for example, Down's Syndrome)
- Learning difficulty (for example, dyslexia)
- Developmental disorder (for example, Autistic Spectrum Disorder or Asperger's Syndrome)
- Physical disability
- Mental health condition
- Long-term illness, disease or condition
- Other condition, please write in:
- No condition
During quality assurance, we identified that there had been a large increase in the proportion of people ticking more than one of these three conditions between 2011 and 2022. Although there are known correlations among these three conditions, the extent of multi-ticking indicates that some respondents with a single condition may have decided to tick more than one box if it was unclear which category their condition should be recorded in. This issue was not identified in the testing carried out when developing the question.
In December 2024 we published the number of people who had at least one of these three conditions as we are confident that the issue has not affected this number.
In June 2025, we published the number of people with a learning difficulty and the number with a developmental disorder, but not the number with a learning disability. The number of people with a learning difficulty increased by 69.6% and the number with a developmental disorder increased by 276.5% between 2011 and 2022. Increases in these condition types are also seen in the Scottish Government Pupil Census, which includes data on Additional Support Need reasons. Some of the categories used are similar to the census learning difficulty and developmental disorder categories, although there may be some differences in the conditions included.
For learning difficulty, the Pupil Census includes three Additional Support Need reason categories that all increased between 2010 and 2021: Dyslexia (increase from 1.3% in 2010 to 3.6% in 2021), Other specific learning difficulty (e.g. numeric) (increase from 0.9% in 2010 to 3.8% in 2021), and Other moderate learning difficulty (increase from 1.6% in 2010 to 4.5% in 2021). For developmental disorders, the Pupil Census reported an increase over the same time period in the Autistic Spectrum Disorder (increase from 1.0% in 2010 to 3.4% in 2021), and Social, emotional and behavioural difficulty (increase from 2.2% in 2010 to 7.8% in 2021) categories.
Between 2011 and 2022, there was an unrealistically large increase in the number of people who ticked learning disability only, or in combination with one or both of the other two conditions. This increase is not seen in Scottish Government Pupil Census data for school children. Pupil Census data shows that the percentage of school pupils with an Additional Support Need reason of ‘learning disability’ was 1.7% in both 2010 and 2021. The unexpectedly large increase in the census data was also accompanied by a change in the age distribution of individuals reporting a learning disability. Rather than being relatively evenly distributed across all ages as in 2011, the 2022 age distribution resembled that for individuals indicating they had a learning difficulty or developmental disorder; a peak in teenagers and young adults, as expected for these conditions following diagnoses at school and in the workplace. In contrast, the age distribution of people with a learning difficulty or developmental disorder is consistent across the 2011 and 2022 censuses.
The Northern Ireland 2021 Census found 1.9% of people in Northern Ireland had Autism or Asperger syndrome and 3.1% had a learning difficulty. This compares with 2.2% of people in Scotland with a developmental disorder (which includes Autism and Asperger syndrome) and 3.3% with a learning difficulty. These percentages are relatively similar between the two countries, which provides further assurance that the 2022 data from Scotland’s census for these categories is robust.
To investigate the response issues further, we linked data from the 2022 and 2011 censuses to analyse individuals who had a learning disability in both censuses and those who only indicated they had a learning disability in the 2022 census. We found that individuals that reported a learning disability in both 2011 and 2022 were far more likely to report their condition as limiting them a lot than individuals that only reported a learning disability in 2022. This was not the case for people with a learning difficulty or developmental disorder, where the percentages of people responding ‘limited a lot’ were more consistent across censuses. These findings support the conclusion that some people who ticked learning disability in 2022 had a condition that should have been recorded as a learning difficulty or developmental disorder.
This also means that the data on the number of people with a learning difficulty or developmental disorder may be a slight undercount of the true number in the population with these conditions. However, we do not believe that this issue would significantly change the number of people in either group.
We have published tables based on the combined data from 2011 and 2022. We focussed on people who reported a learning disability in both censuses. We can be confident that people in this group have a learning disability and have not misinterpreted the census question in 2022. The published tables show the number of people in this cohort and their characteristics.
These tables only include people with a learning disability who responded to the 2011 and 2022 censuses. For example, people born after 2011 and people who moved to Scotland after 2011 are excluded. This means the tables are not representative of the total population of people with a learning disability. And they do not show how the size of this population has changed over time. But they do provide some insight into how the circumstances and characteristics of people with learning disabilities changed between censuses.
It should also be noted that taking the number of people with at least one of the three conditions and subtracting those with a learning difficulty and developmental disorder does not provide the number of people with a learning disability. As noted previously, people could tick multiple conditions. And the level of people who chose to do this in 2022 was much higher than 2011.
Disability and health problems which limit day-to-day activities
Data on disability are collected by asking all people ‘Are your day-to-day activities limited because of a health problem or disability which has lasted, or is expected to last, at least 12 months?’. This question is unchanged from 2011 and the data are comparable with previous censuses.
105,800 people (1.9%) indicated they had no long-term health condition, but activities were limited by a health problem or disability. This is similar to 2011 when this figure was 2.0%. Data users should note this when comparing census data on disability with other sources.
In Scotland, 24.1% of people had a disability using this definition, slightly lower than 25.6% of people in Northern Ireland. Data are not comparable with England & Wales because their census had two linked questions about long-term conditions and disability. A lower percentage had a disability in England & Wales at 17.8%.Only individuals with a long-term condition were asked the disability question. Whereas in Scotland and Northern Ireland, the questions on long-term conditions and disability were unlinked and were both asked of everybody.